AHRI: Water heater shipments increase in October
U.S. shipments of residential gas storage water heaters rise 11.5%


NOTE: A shipment is defined as when a unit transfers ownership; a consignment is not a transfer of ownership. Industry data is aggregated from the information supplied by AHRI member companies that participate in the statistics program and could be subject to revision. Published year-to-date data is inclusive of all revisions. No other AHRI data (e.g., by state or region) is available to the general public other than that published. AHRI does not conduct any market forecasting and is not qualified to discuss market trends. For previous monthly shipment releases and historical data, please see www.ahrinet.org/statistics.
Residential Storage Water Heaters
U.S. shipments of residential gas storage water heaters for October 2018 increased 11.5%, to 373,450 units, up from 334,854 units shipped in October 2017. Residential electric storage water heater shipments increased 2% in October 2018 to 341,572 units, up from 334,901 units shipped in October 2017.
Year-to-date U.S. shipments of residential gas storage water heaters increased 3.7%, to 3,768,786, compared to 3,633,403 shipped during that same period in 2017. Residential electric storage water heater shipments increased 2.8% year-to-date, to 3,540,518 units, compared to 3,443,093 shipped during the same period in 2017.
Commercial Storage Water Heaters
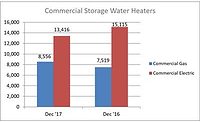
Commercial gas storage water heater shipments decreased 4.9% in October 2018, to 6,822 units, down from 7,174 units shipped in October 2017. Commercial electric storage water heater shipments decreased 33.7% in October 2018, to 10,843 units, down from 16,365 units shipped in October 2017.
Year-to-date U.S. shipments of commercial gas storage water heaters increased 1.7%, to 79,674 units, compared with 78,355 units shipped during the same period in 2017. Year-to-date commercial electric storage water heater shipments decreased 7.9%, to 114,453 units, down from 124,230 units shipped during the same period in 2017.
Warm Air Furnaces
U.S. shipments of gas warm air furnaces for October 2018 increased 20.5%, to 315,463 units, up from 261,794 units shipped in October 2017. Oil warm air furnace shipments decreased 6.9%, to 4,493 units in October 2018, down from 4,827 units shipped in October 2017.
Year-to-date U.S. shipments of gas warm air furnaces increased 10.5%, to 2,804,483 units, compared with 2,538,683 units shipped during the same period in 2017. Year-to-date U.S. shipments of oil warm air furnaces increased 2.8%, to 29,046 units, compared with 28,249 units shipped during the same period in 2017.
Central Air Conditioners and Air-Source Heat Pumps
U.S. shipments of central air conditioners and air-source heat pumps totaled 507,199 units in October 2018, up 11.4% from 455,303 units shipped in October 2017. U.S. shipments of air conditioners increased 6.6%, to 311,728 units, up from 292,559 units shipped in October 2017. U.S. shipments of air-source heat pumps increased 20.1%, to 195,471 units, up from 162,744 units shipped in October 2017.
Year-to-date combined shipments of central air conditioners and air-source heat pumps increased 7.2%, to 7,397,877, up from 6,900,365 units shipped in October 2017. Year-to-date shipments of central air conditioners increased 4.6%, to 4,832,854 units, up from 4,621,922 units shipped during the same period in 2017. The year-to-date total for heat pump shipments increased 12.6%, to 2,565,023, up from 2,278,443 units shipped during the same period in 2017.
Looking for a reprint of this article?
From high-res PDFs to custom plaques, order your copy today!


